Teacher Explains
✨ Introduction to Data Handling
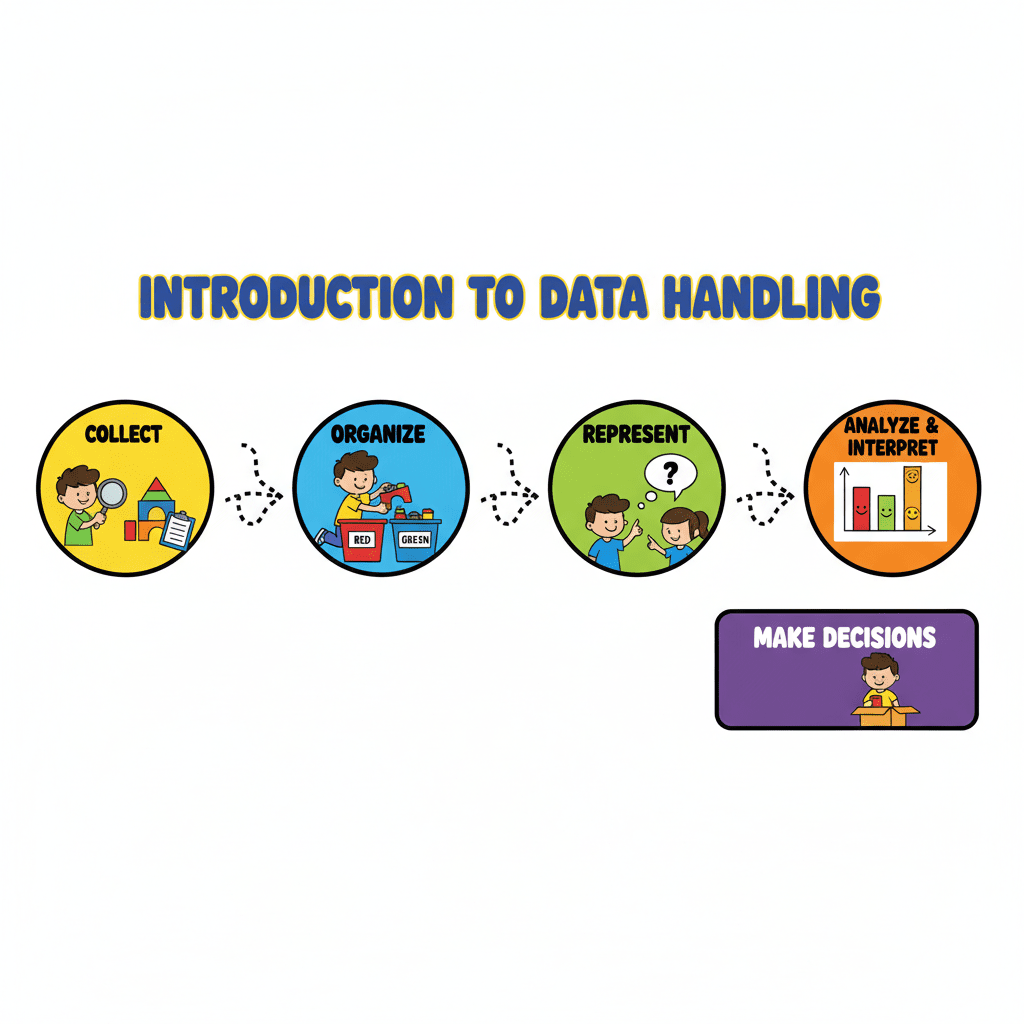
Hey everyone, great to see you all! Let's dive into a bit of data handling today. Imagine this: a group of students, just like you, decided to clean up their local beach. How awesome is that?
✨ The Beach Clean-up Scenario
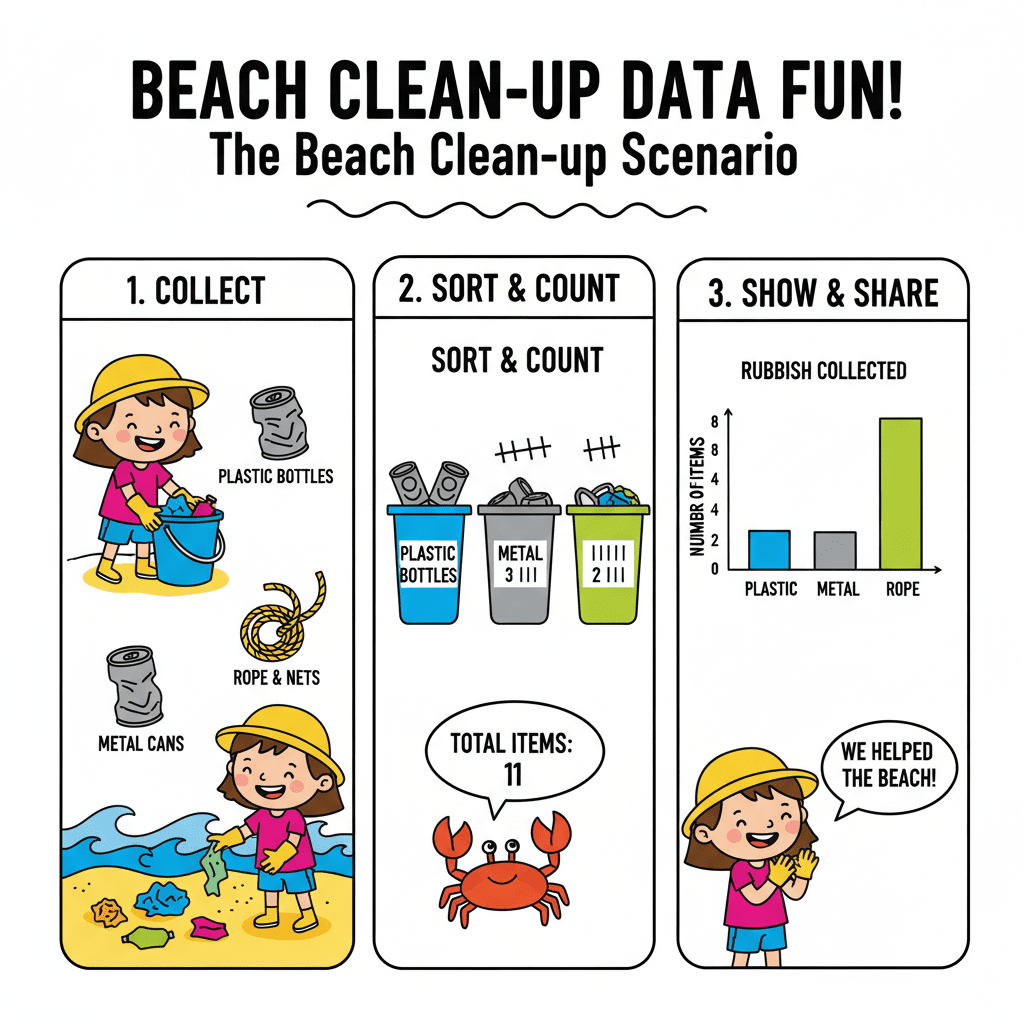
They collected all sorts of trash – plastic bottles, cans, wrappers, you name it – and sorted them into bags. Now, we have a bar chart here that shows exactly how many bags of each type of trash they gathered. It’s like a snapshot of their hard work!
✨ Understanding the Bar Chart
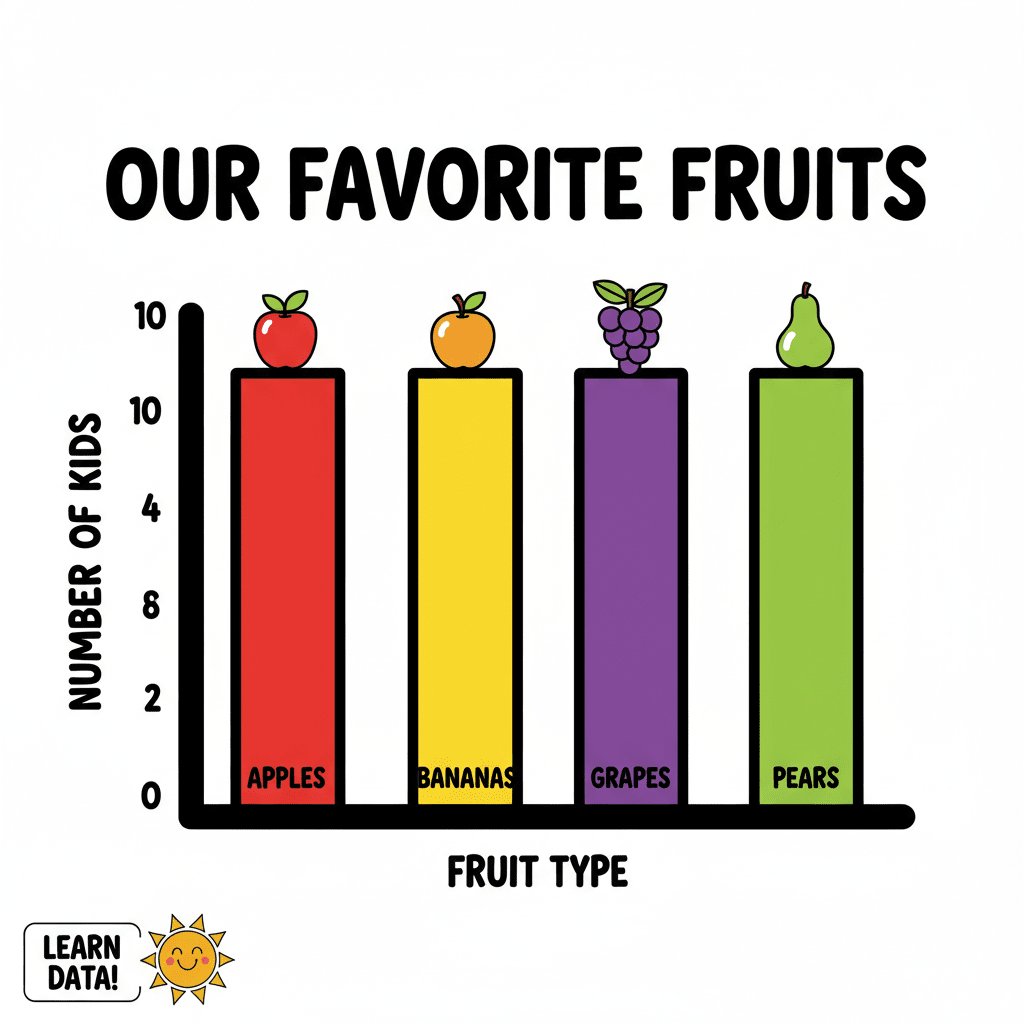
Take a look at the chart. On the bottom, you'll see the different kinds of trash. On the side, you will see the number of bags filled. Can you tell me which type of trash they collected the most of? And which one they collected the least of? We're going to use this chart to understand and interpret data, just like real-world scientists and environmentalists do. So, let's put on our data detective hats and explore this beach clean-up data together!
